Let us enhance our learning
- The normal temperature of a healthy human being is
close to .
(i) 98.6 °C
(ii) 37.0 °C
(iii) 32.0 °C
(iv) 27.0 °C
Ans: The normal temperature of a healthy human being is close to (ii) 37.0 °C.
- 37 °C is the same temperature as .
(i) 97.4 °F
(ii) 97.6 °F
(iii) 98.4 °F
(iv) 98.6 °F
Ans: The correct answer is (iv) 98.6 °F.
- Fill in the blanks:
(i) The hotness or coldness of a system is determined by its ……………………………………
(ii) The temperature of ice-cold water cannot be measured by a …………………………………… thermometer.
(iii) The unit of temperature is degree ……………………………………
Ans:
(i) The hotness or coldness of a system is determined by its temperature.
(ii) The temperature of ice-cold water cannot be measured by a clinical thermometer.
(iii) The unit of temperature is degree Celsius.
- The range of a laboratory thermometer is usually .
(i) 10 °C to 100 °C
(ii) –10 °C to 110 °C
(iii) 32 °C to 45 °C
(iv) 35 °C to 42 °C
Ans: The range of a laboratory thermometer is usually (ii) –10 °C to 110 °C.
- Four students used a laboratory thermometer to measure
the temperature of water as shown in Fig. 7.6:
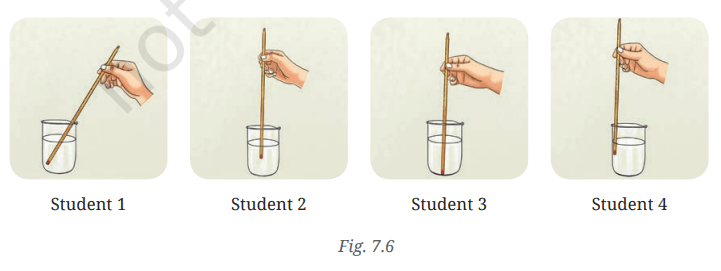
Who do you think followed the correct way for measuring
temperature?
(i) Student 1
(ii) Student 2
(iii) Student 3
(iv) Student 4
Ans: Student 2, To determine which student followed the correct method for measuring temperature, we need to consider the proper technique for using a laboratory thermometer. The correct method includes:
Reading the Temperature: The reading should be taken while the thermometer is still in the liquid, ensuring that the eye is level with the liquid column for an accurate reading.
Immersion: The bulb of the thermometer should be fully immersed in the liquid without touching the sides or bottom of the container.
Vertical Position: The thermometer should be held vertically.
- Colour to show the red column on the drawings of thermometers (Fig. 7.7) as per the temperatures written below:
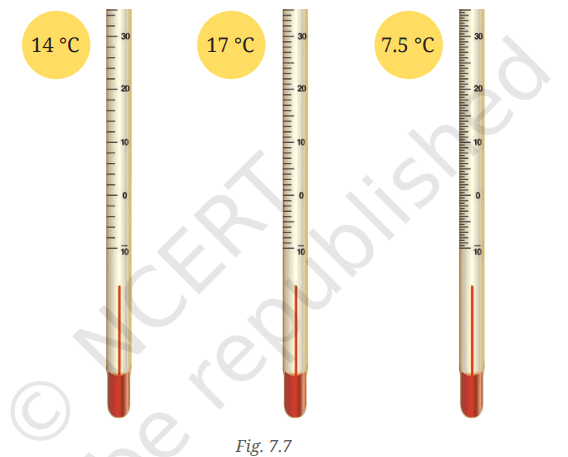
Ans: Colour to show the red column on the drawings of thermometers (Fig. 7.7) as per the temperatures written below:
- 14 °C
- 17 °C
- 7.5 °C
Instructions for Colouring:
- Identify the Temperature Marks:
- Locate the temperature markings on the thermometer drawings provided in Fig. 7.7.
- Colouring the Red Column:
- For 14 °C, colour the section of the thermometer that corresponds to this temperature mark.
- For 17 °C, colour the section that aligns with this temperature.
- For 7.5 °C, colour the section that matches this temperature.
- Ensure Accuracy:
- Make sure to colour only the sections that represent the specified temperatures, ensuring clarity and neatness.
This activity helps in understanding how to read and interpret thermometer scales accurately. By colouring the red column, students can visually connect the temperature readings with the corresponding levels on the thermometer.
7.
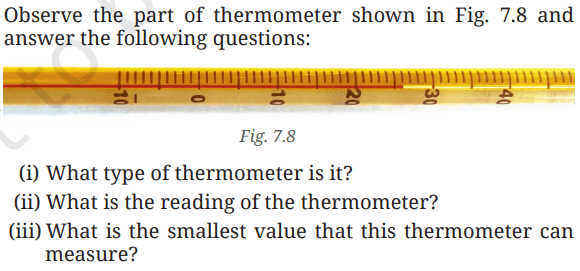
Ans: (i) The thermometer shown in Fig. 7.8 is a laboratory thermometer. Laboratory thermometers are designed to measure the temperature of liquids and can typically measure a wider range of temperatures compared to clinical thermometers.
(ii) The reading of thermometer is 26 °C. To determine the reading of the thermometer, observe the level of the liquid column in relation to the marked scale.
(iii) The smallest value this thermometer can measure is -10 °C, To find the smallest value that the thermometer can measure, look at the scale and identify the temperature difference between two consecutive larger marks. Count the number of smaller divisions between these larger marks to calculate the value of each small division. The smallest value is typically the temperature indicated by one small division.
- A laboratory thermometer is not used to measure our body temperature. Give a reason.
Ans: A laboratory thermometer is not suitable for measuring body temperature primarily due to its design and temperature range. Here are the key reasons:
- Temperature Range: Laboratory thermometers typically have a range from –10 °C to 110 °C. While this range may seem adequate, it is not specifically calibrated for the narrower range of human body temperatures, which are usually around 35 °C to 42 °C.
- Precision: Clinical thermometers are designed to provide precise readings within the normal body temperature range, while laboratory thermometers may not offer the same level of accuracy for such specific measurements.
- Measurement Method: Laboratory thermometers are intended for use in liquids and may require immersion in a substance. In contrast, clinical thermometers are designed for direct contact with the human body, ensuring a more accurate reading of body temperature.
- Safety Concerns: Many laboratory thermometers contain mercury, which is toxic. If a laboratory thermometer breaks, it poses a health risk. Clinical thermometers, especially digital ones, are safer and easier to use.
In summary, due to their design, range, and intended use, laboratory thermometers are not appropriate for measuring human body temperature.
- Vaishnavi has not gone to school as she is ill. Her mother has kept a record of her body temperature for three days as shown in Table 7.4.
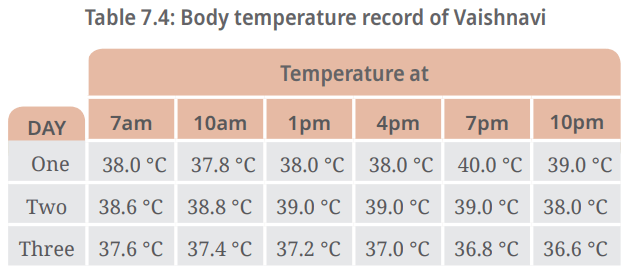
(i) What was Vaishnavi’s highest recorded temperature?
(ii) On which day and at what time was Vaishnavi’s highest temperature recorded?
(iii) On which day did Vaishnavi’s temperature return to normal?
Ans: Based on the provided data regarding Vaishnavi’s body temperature, here are the answers to your questions:
(i) Vaishnavi’s highest recorded temperature was 40 °C.
(ii) Vaishnavi’s highest temperature of 40 °C was recorded on Day One at 7pm.
(iii) Vaishnavi’s temperature returned to normal on Day Three, as her readings showed a decline to 37.0 °C and continued to decrease thereafter.
- If you have to measure the temperature 22.5 °C, which of the following three thermometers will you use (Fig. 7.9)? Explain.
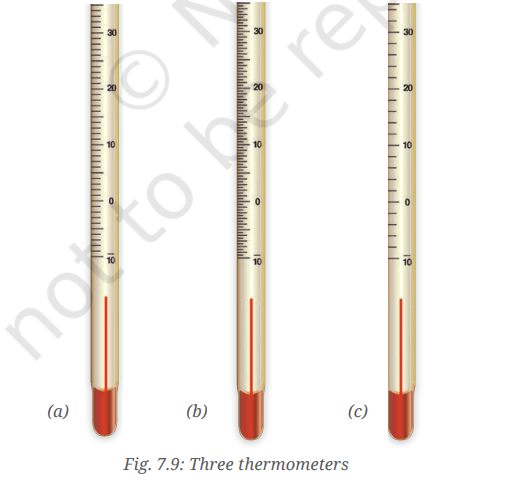
Ans: To determine which thermometer to use for measuring a temperature of 22.5 °C, we need to consider the specifications and scales of the three thermometers shown in Fig. 7.9. Here’s a structured approach to making the selection:
- Identify the Thermometers:
- Thermometer (a): Smallest division 1 °C.
- Thermometer (b): Smallest division 0.1 °C.
- Thermometer (c): Smallest division 2 °C.
- Temperature Range:
- Ensure that the thermometer can measure temperatures within the range that includes 22.5 °C.
- For example, if a thermometer has a range of 0 °C to 50 °C, it is suitable for measuring 22.5 °C.
- Smallest Division:
- The smallest division of the thermometer should allow for accurate measurement of 22.5 °C.
- A thermometer with smaller divisions (like 0.1 °C) will provide a more precise reading than one with larger divisions (like 1 °C).
Based on the above criteria, we would select the thermometer that:
- Has a temperature range that includes 22.5 °C.
- Offers a smallest division that allows for accurate readings at that temperature.
So we would select, Thermometer (b).
11. The temperature shown by the thermometer in Fig. 7.10 is:
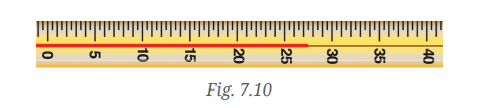
(i) 28.0 °C
(ii) 27.5 °C
(iii) 26.5 °C
(iv) 25.3 °C
Ans: (ii) 27.5 °C
- A laboratory thermometer has 50 divisions between 0 °C and 100 °C. What does each division of this thermometer measure?
Ans: To determine the measurement of each division on a laboratory thermometer that has 50 divisions between 0 °C and 100 °C, we can use the following calculation:
Number of Divisions: There are 50 divisions in this range.
Total Temperature Range: The range is from 0 °C to 100 °C, which is a total of 100 °C.
Thus, each division of the laboratory thermometer measures 2 °C.
- Draw the scale of a thermometer in which the smallest division reads 0.5 °C. You may draw only the portion between 10 °C and 20 °C.
Ans: Draw a thermometer scale where the smallest division reads 0.5 °C, we will represent the temperature range from 10 °C to 20 °C. Below is a textual representation of how the scale would look:
|----|----|----|----|----|----|----|----|----|----|----|----|----|----|----|----|----|----|----|----|----|----|----|----|---
10.0 10.5 11.0 11.5 12.0 12.5 13.0 13.5 14.0 14.5 15.0 15.5 16.0 16.5 17.0 17.5 18.0 18.5 19.0 19.5 20.0- Each vertical line represents a temperature mark.
- The numbers below the lines indicate the temperature in degrees Celsius.
- The distance between each mark is equal, representing an increment of 0.5 °C.
- This scale allows for precise readings within the specified temperature range.
- Draw a horizontal line to represent the thermometer scale.
- Mark the intervals at every 0.5 °C from 10 °C to 20 °C.
- Label each mark with the corresponding temperature value.
This representation can be used for educational purposes to help students understand how to read a thermometer with smaller divisions.
- Komal tells you that she has a fever of 101 degrees. Does she mean it on the Celsius scale or Fahrenheit scale?
Ans: To determine whether Komal’s fever of 101 degrees is measured on the Celsius scale or the Fahrenheit scale, we need to consider the typical temperature ranges associated with each scale.
- Celsius Scale:
- The normal body temperature for a healthy adult is approximately 37.0 °C.
- A fever is generally considered to be a body temperature of 38.0 °C (100.4 °F) or higher.
- Therefore, a temperature of 101 °C would be extremely high and not typical for a human body.
- Fahrenheit Scale:
- The normal body temperature in Fahrenheit is about 98.6 °F.
- A fever in Fahrenheit is typically around 100.4 °F or higher.
- Thus, a temperature of 101 °F is a common indication of fever.
Given this information, it is likely that when Komal says she has a fever of 101 degrees, she is referring to the Fahrenheit scale.